Moving map
I started both gliding and my studies in Computer Science in 2003. A few years later, in 2006, things started to itch. I looked at the state of glide computers at that time, and wondered: “Why are these things so expensive? I bet I can do better!”. So, as part of a project on embedded systems, I wrote a small moving map display for an iPaq 5550. The software was very simple: it would connect over Bluetooth to a GPS and display a trace on Geocover2000 tiles that I downloaded from NASA’s WorldWind server. The color of the trace showed a GPS vario value measured at that location.
This system was easy to use, and because I owned no glider at the time, I took it along for some flights in my club’s Ka8.
First variometer
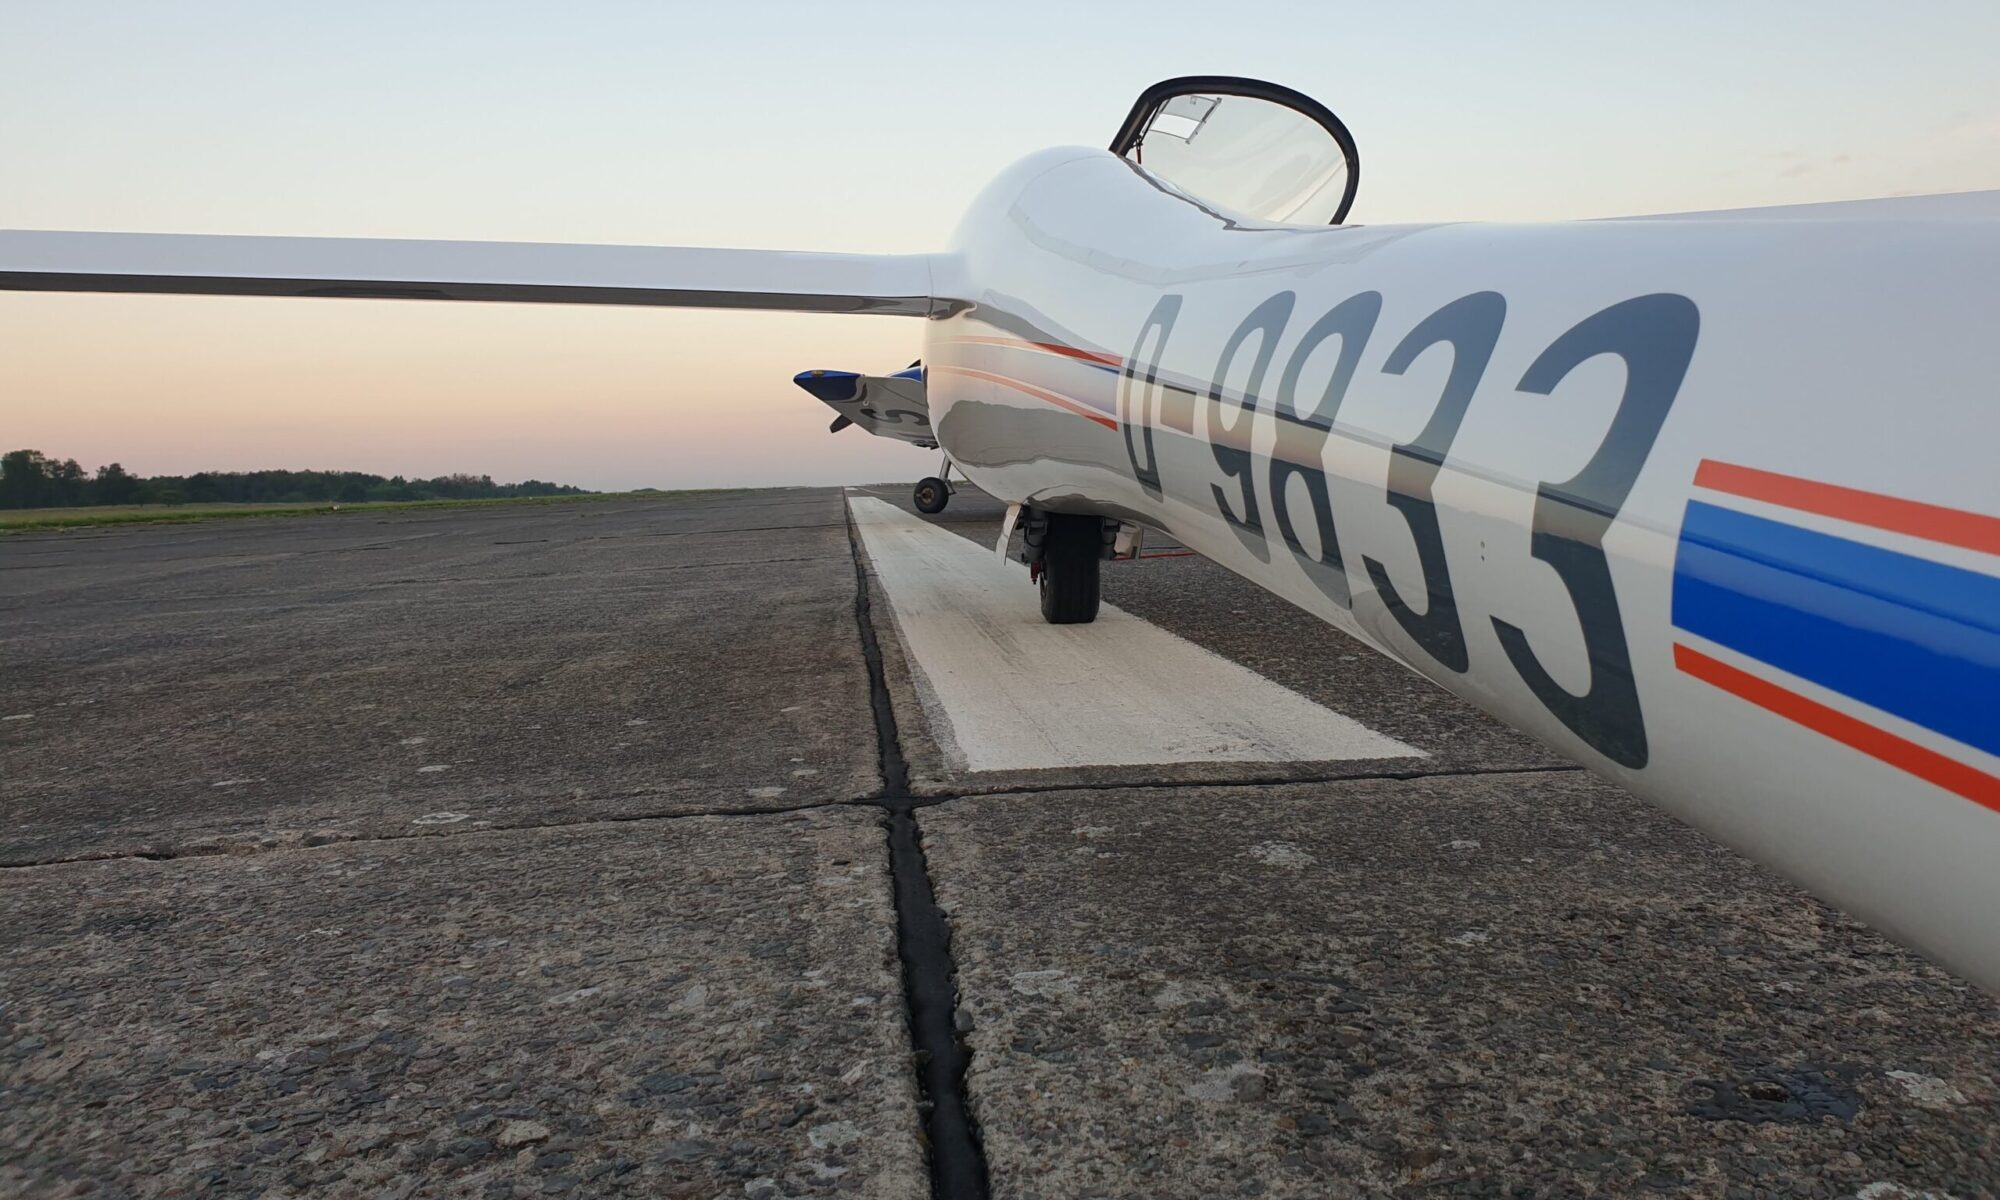
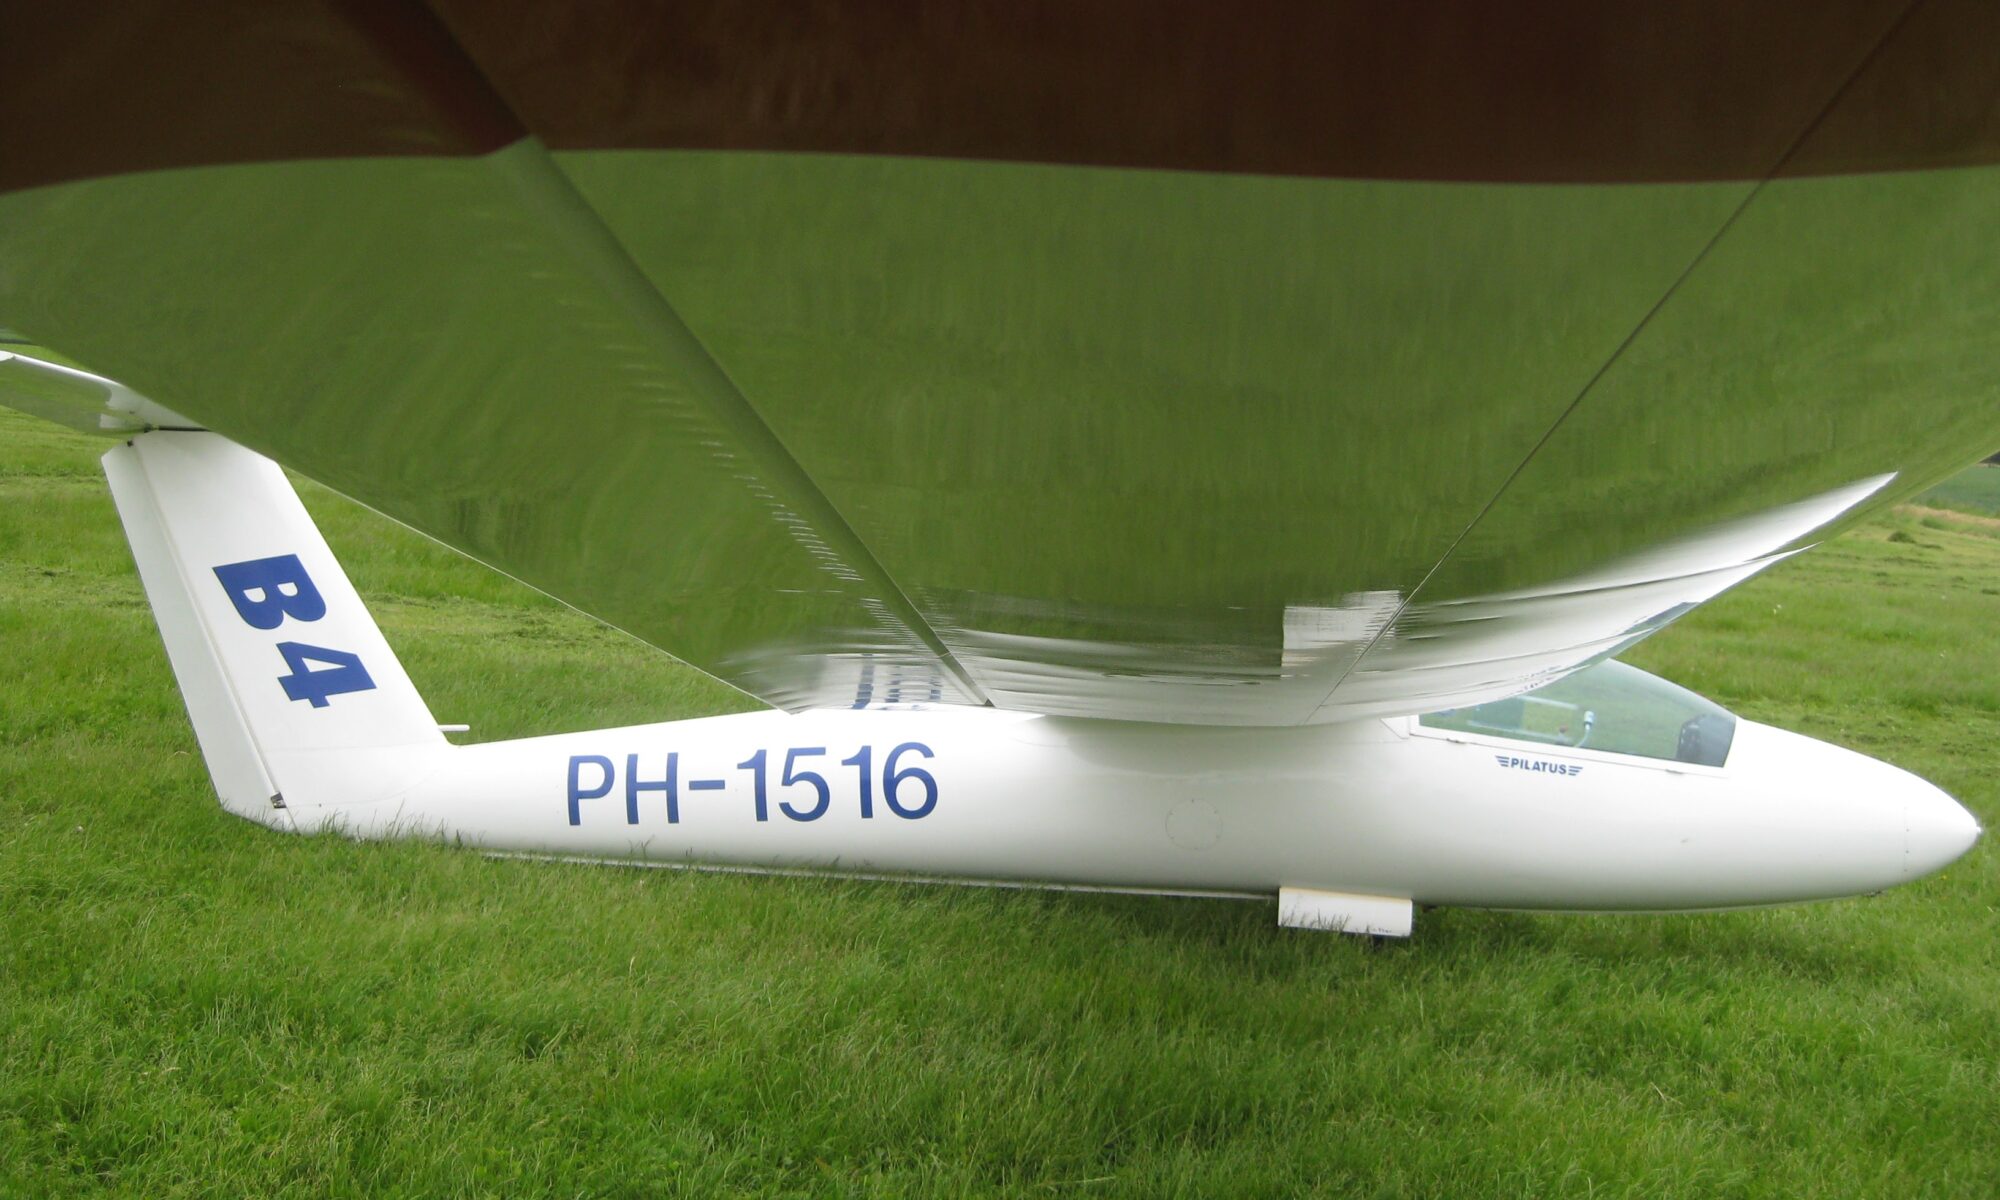
All this was very nice, but I quickly realized that in order to do anything remotely useful, I would need to measure a properly compensated variometer value. And, having measured this compensated variometer value, it should be shown in a friendly manner. I owned a Pilatus B4, so I could finally integrate some electronics.
I decided to start with the variometer gauge first, and I was able to convince Mike Borgelt to share with me the protocol for steering the second-seat version of his variometers. I bought a Beaglebone, a BMP085 barometric pressure sensor, a USB-to-RS485 dongle for the Borgelt gauge and a casing and started experimenting.
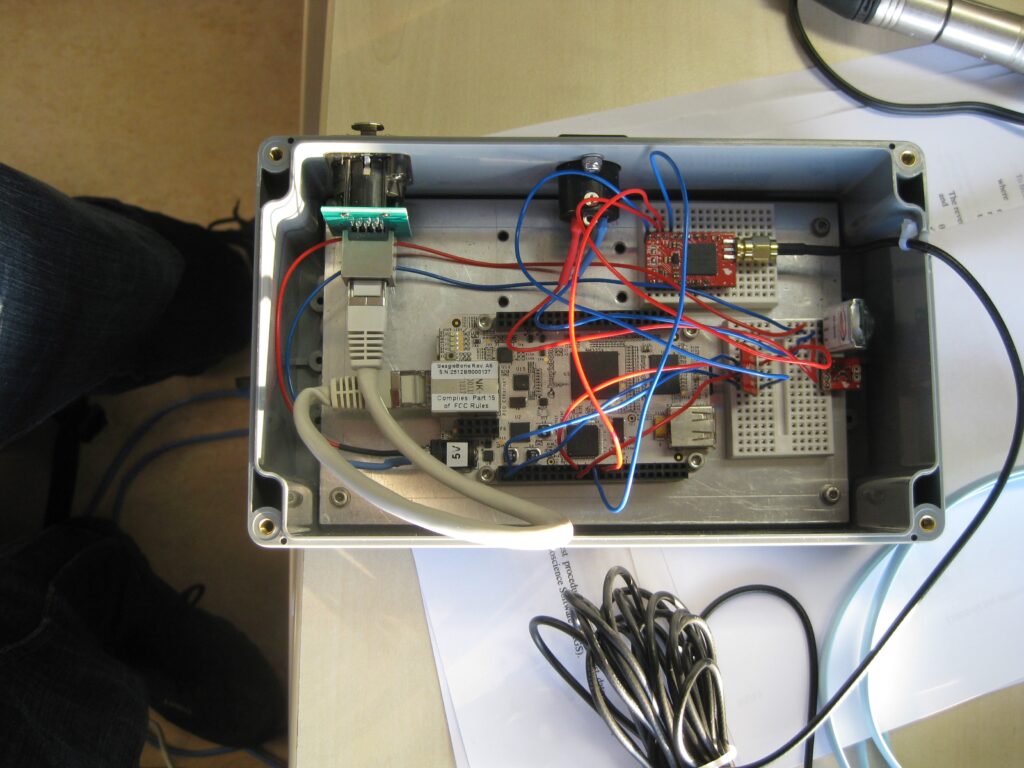
The first test revealed something important: all these electronics are interfering with my radio! Every time I turned on my newly made electronics box, the radio would constantly start receiving noise. No amount of squelch could prevent this.
I told one of my colleagues with an electronics degree, and he suggested I put aluminium tape on the inside of my electronics box. Scratching the tape made the different layer contact each other and would shield the outside world against EMC from the Beaglebone and the switching 12-to-5 Volt converter I used. This made matters much better, but interference would still be present whenever I ran cables next to my glider’s power supply cabling. A piece of ferrite finally fixed things enough so I could start testing my new uncompensated variometer gauge. To the airfield!
This variometer used a simple Kalman filter to reduce the noise in the vario signal. Using some known information about the Pilatus B4 like its stall-speed, I could assign confidence numbers to the noisy readings I was getting from the BMP085. This allowed my Kalman filter to reduce the noise from my measurements, by looking at what’s physically likely to happen.
Measuring polar curves
During the same period I had followed a course on Modern Design of Experiments (MDOE) at work. The basic premise of this course is that – given a clear objective, a physical model of the phenomenon to be measured and a required accuracy – one can derive a mathematical model (response surface) of a system using just a few strategically chosen measurements. This contrasts the more traditional method of taking a lot of data and thinking about the mathematical model afterwards. In wind tunnels it saves a lot of measurement time, so it might reduce the number of datapoints I need to measure to get a plausible polar curve for the B4 too.
I had already obtained a polar curve of the Pilatus B4 from Idaflieg, so I had a pretty good idea what my results would look like. With this information, I could pick the few measurement points that I should measure. Since most software uses a formula of the form a*x2 + b*x + c, I opted to use that as well. That meant I would want to measure at the extremes, the points with most leverage, to determine the linear part of this function optimally and measure right in the middle to determine the quadratic part optimally.
I towed to 2 kilometers and flew timed descents on MacCready 0 speed, MacCready 5 speed and in the middle. In order to estimate the average wind direction and wind speed, I flew a few circles with constant speed and heading in between each pair of measurement points. The drift in these circles would give me an estimate of the horizontal wind.
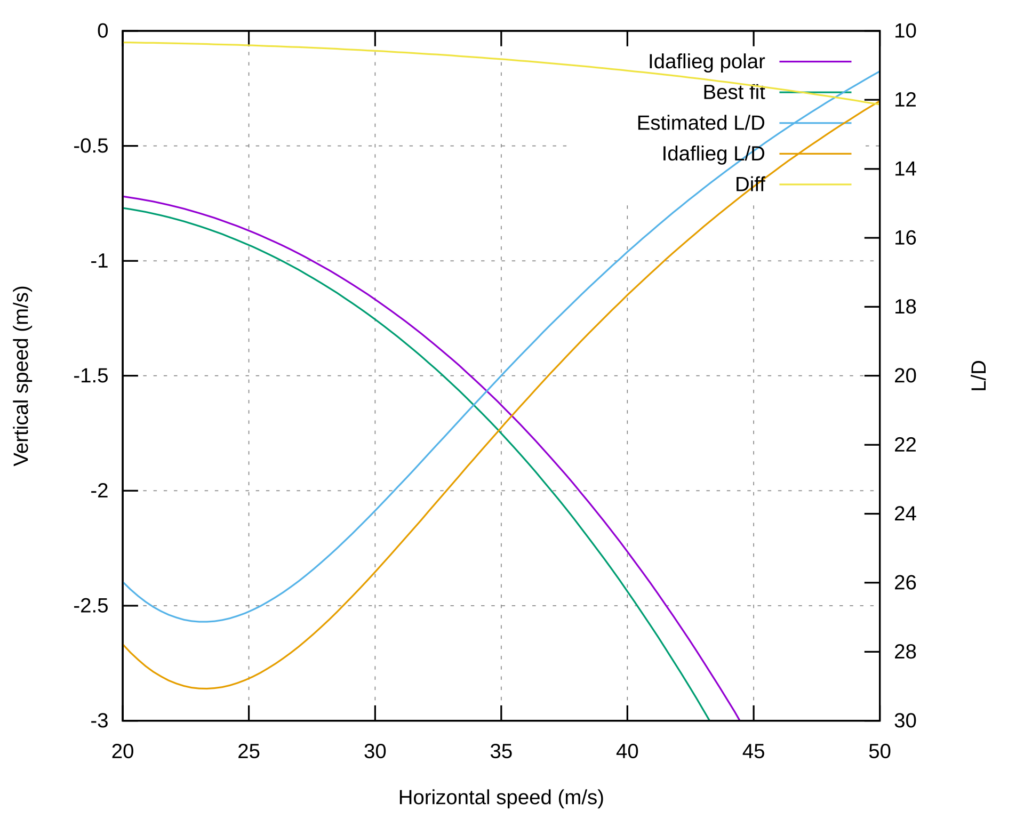
The results looked pretty okay. As expected, my Pilatus B4 performed a little bit worse than the one measured at Idaflieg. That was not a surprise to me: I had some scratches on the leading edge of my wings, and the fairing at the wing-fuselage intersection was deformed from assembly mishaps. Taping was no longer possible. I also flew the glider mainly for aerobatics, so it didn’t receive the TLC one would give to a high-performance cross-country glider.
Although I realized that I still had a lot to learn and technical challenges to overcome, being able to derive a plausible polar curve using just a noisy barometric pressure sensor inside my cockpit was encouraging. In the meantime I had learned about statistics and implemented my first Kalman filter! I had evaluated the filter in terms of resonance and response time, and it had worked in practice! I was hooked, avionics became my poison.